-
$44.67Ships in 3-5 Business Days
-
$42.22Ships in 3-5 Business Days
-
$44.67Ships in 3-5 Business Days
-
$42.22Ships in 3-5 Business Days
When a health inspector, a quality auditor, or a customer asks whether that walk-in held temperature over the weekend, a circular chart answers the question in one glance. Chart recorders have been the standard for documenting refrigeration temperatures for decades because they work without a computer, a network, or a login. Clip on a chart, set the time, and the recorder draws a continuous trace that anyone can read and file.
This category covers Supco circular chart recorders, including the CR87 series for temperature and pressure, along with the replacement charts and supplies that keep them running. Charts are available in common rotation periods, including 6-hour, 24-hour, 7-day, and 31-day, so you can match the level of detail to how the record will be used.
Restaurants and commercial kitchens use chart recorders on coolers and freezers as part of a HACCP plan. Refrigeration contractors use them as a diagnostic tool, leaving one on a case or walk-in to catch defrost problems, door-left-open events, or a compressor that short-cycles overnight. Labs, florists, pharmacies, and warehouses use them where a paper trail is required or simply preferred.
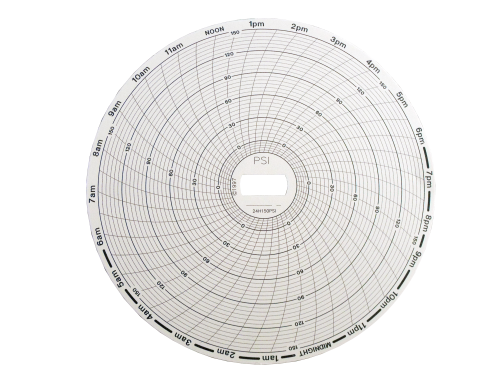
A circular chart recorder has three basic parts: a clock-driven chart plate, a sensing element, and a pen arm. The chart turns at a fixed rate, one full revolution per rotation period, while the pen moves in and out across the chart's radius as the measured value changes. The result is a continuous line plotted against time.
Because the trace is continuous, a chart shows more than a spot reading ever could: how long defrost lasted, how fast the box recovered, whether temperature spiked during a delivery, and whether the system held steady through the night.
Shorter rotations spread time across more of the chart, so you see more detail. Longer rotations compress time but require fewer chart changes.
Charts are model-specific. Confirm the recorder model, the chart diameter, the temperature or pressure range, and the rotation before ordering. A chart with the wrong range will plot the pen in the wrong place, and a chart with the wrong rotation will misstate time. The product pages list compatible recorder models.
A freezer chart needs a range that covers well below 0°F. A cooler chart should cover the normal holding range plus enough headroom to show a failure. Pick a range that keeps the normal operating line away from the chart edges.
Decide where the recorder will live, whether a remote probe is needed, and how it will be powered. Mount it where staff will see it and change the chart on schedule.
| Chart rotation | Change frequency | Detail level | Best for |
|---|---|---|---|
| 6-hour | Every 6 hours | Highest | Diagnosing cycling, defrost, and short events |
| 24-hour | Daily | High | Daily food safety logs, overnight troubleshooting |
| 7-day | Weekly | Moderate | Routine cooler and freezer records |
| 31-day | Monthly | Lower | Stable storage with monthly documentation |
A HACCP plan identifies critical control points and requires monitoring and records to prove they stayed in limits. For refrigerated storage, temperature is the critical limit, and a chart recorder provides continuous monitoring with a dated, initialed record. Check your local health department and your own HACCP plan for the exact requirements, including how long records must be kept. Many operations use the FDA Food Code cold-holding limit of 41°F or below for cooler storage, but your plan and local rules govern.
Supco has built test and monitoring instruments for the refrigeration trade since 1945, and its chart recorders and charts are a familiar sight in commercial kitchens and on service trucks. HVAC365 lists compatible models and specs on each product page, with spec sheets where available, so you can match charts to your recorder before ordering. Charts and recorders ship in 3-5 business days, so you can reorder before you run through your last pack.
No. The chart drive turns at a fixed rate set by the recorder. A chart with a different rotation will misstate time. Use only charts that match the recorder model and its rotation, unless the recorder is designed with a selectable rotation.
A 6-hour or 24-hour chart gives you enough detail to see compressor cycles, defrost periods, and recovery times. Once the problem is solved, switch back to a 7-day chart for routine records.
Compare it to a calibrated reference thermometer at the probe location. If it reads off, follow the recorder's calibration procedure. Record each check so you have proof of verification.
Chart recorders are widely used for HACCP temperature monitoring because they provide a continuous, dated record. Your local health department and HACCP plan set the specific requirements, so confirm with them.
Data loggers store readings digitally and are easier to archive and analyze on a computer. Chart recorders give a visible, instant record without software. Many operations use both: a chart on the door for staff and inspectors, and a logger for long-term data.
The most common causes are a dry pen, a pen arm that is not touching the chart evenly, or a stalled chart drive from weak batteries or a power interruption. Replace the pen first, then check power and the drive.

Fast Shipping

Easy Returns

Warranty Coverage

Financing Available